
Macular telangiectasia type 2 (MacTel) is a neurodegenerative disease affecting the parafoveal region of the retina, causing loss of central vision. Microperimetry testing is used to monitor progression of vision loss in patients with MacTel, during which multiple points on the retina are tested for sensitivity to light. Recent advances in imaging technology have correlated the focal light sensitivity defects that occur with MacTel to at least one structural defect, ellipsoid zone loss. We hypothesized that a deep learning model could be trained to estimate retinal sensitivity using structural details identified on optical coherence tomography (OCT) images and microperimetry data, providing a detailed high-resolution functional map of the retina that may be useful for research purposes or when microperimetry is not feasible.
Our model is implemented as a deep convolutional neural network with a regression output. By setting the anatomic structure as an input (localized vertical slice of the OCT) and an objective functional measurement (retinal sensitivity at that location measured by microperimetry) as output, we hoped to create a neural network that could estimate function from structure directly de novo. Our model successfully delineated regions of normal against reduced retinal sensitivities, and quickly produced reliable information that compared well with microperimetry results.
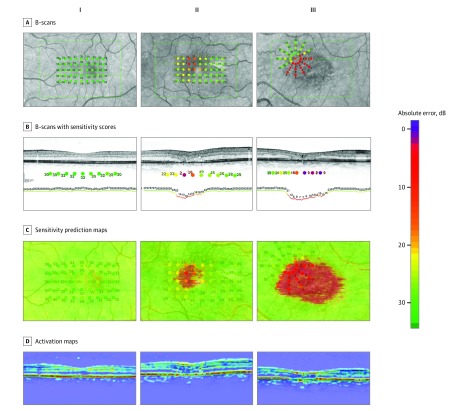
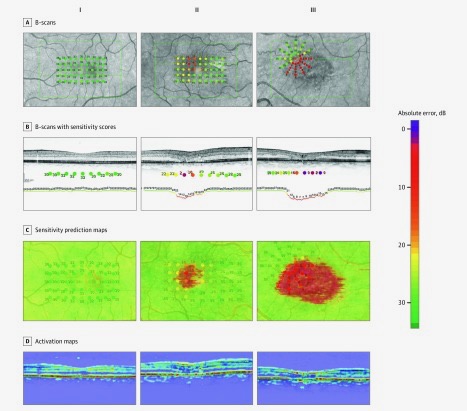
Three patients with MacTel with varying level of disease severity were chosen from the test set (I, II, III). A, The B-scans that crossed the microperimetry stimuli (green line) were chosen. B, The sensitivity scores were overlaid with those B-scans. The color of those overlaid stimuli was manually corrected, resulting in a discrete color scale for each sensitivity score. After deep learning, the model was able to generate a sensitivity estimation line (below optical coherence tomography B-scan), which showed a good correlation with the observed sensitivities. C, Those prediction lines were stitched together to create high-resolution en face sensitivity estimation maps. D, Activation maps of the B-scan, highlighting the regions that the model used for its estimations. Hot areas (red) corresponded to areas most important for the model to estimate normal perimetry values.
This was a proof of principle study, and our findings offer the potential to train the model using other more common diseases, such as age-related macular degeneration and diabetic retinopathy. This model could be useful for clinics that do not have a microperimetry device, as OCTs are available almost everywhere. Many patients are unable to perform demanding microperimetry scanning (i.e. children, elderly, or disabled patients) due to the long period of concentration required, so the model could be helpful for monitoring disease progression in these patients. We believe it may also be useful as a surrogate outcome measure in investigational treatment trials.
Kihara Y, Heeren TFC, Lee CS, Wu Y, Xiao S, Tzaridis S, Holz FG, Charbel Issa P, Egan CA, Lee AY. Estimating Retinal Sensitivity Using Optical Coherence Tomography With Deep-Learning Algorithms in Macular Telangiectasia Type 2. JAMA Netw Open. 2019 Feb 1;2(2):e188029. doi: 10.1001/jamanetworkopen.2018.8029. PubMed PMID: 30735236; PubMed Central PMCID: PMC6484597